Pricing & Revenue
US short-term rental occupancy, ADR & RevPAR statistics (2026)
AirDNA and RevFactor's dated 2026 figures for US short-term rental occupancy, ADR, and RevPAR, plus why the same publisher's own numbers do not always agree.

On this page
- What is the average short-term rental occupancy rate in the US?
- What is the average daily rate (ADR) for US short-term rentals?
- What is RevPAR, and what's the current US benchmark?
- How much does occupancy vary by season?
- What active revenue management is worth
- Why do occupancy and ADR figures disagree between sources?
- How far can the national average be from your market?
- Sources, methodology, and update schedule
- Frequently asked questions
- Conclusion
- About the author
Ask two different reports for the current US short-term rental occupancy rate, and you can get two different, equally correct answers. One might say 57.4%. Another might say 68.4%. Neither is wrong. They're measuring different windows of time, sometimes from the same data provider in the same year.
This guide collects the current, independently verified US short-term rental statistics for occupancy, average daily rate (ADR), and RevPAR, each tied to its original source and publish date. It's written for hosts who run one listing or a handful of them, not portfolio investors comparing markets, and sits alongside RentalWe's other Pricing & Revenue coverage. Past the numbers themselves, it explains why sources disagree so often, so you can pick the figure that actually answers your question instead of guessing which headline to trust.
Key Takeaways
- US short-term rentals are on pace to average 57.4% occupancy for full-year 2026, above the 57.0% pre-pandemic average (AirDNA, 2026 Midyear Outlook, Jul 8, 2026).
- Occupancy hit 68.4% in July 2026 (+0.3% year-over-year), the summer peak month (AirDNA, "U.S. Review July 2026," Aug 13, 2026).
- Occupancy eased to 57.8% in August 2026 (-3.3% YoY), though AirDNA attributes most of that drop to a Labor Day calendar shift, not weaker demand (AirDNA, "U.S. Review August 2026," Sep 16, 2026).
- Average daily rate reached $317.55 in July 2026 (+6.9% YoY), the fastest ADR growth since August 2024 (AirDNA, "U.S. Review July 2026," Aug 13, 2026).
- ADR cooled to $287.34 in August 2026 (+2.7% YoY) (AirDNA, "U.S. Review August 2026," Sep 16, 2026).
- RevPAR reached $217.17 in July 2026 (+7.2% YoY) (AirDNA, "U.S. Review July 2026," Aug 13, 2026).
- RevPAR was $166.01 in August 2026 (-0.6% YoY), again largely a calendar-shift effect by AirDNA's own account (AirDNA, "U.S. Review August 2026," Sep 16, 2026).
- AirDNA forecasts full-year 2026 RevPAR growth of +2.9%, driven almost entirely by rising ADR rather than higher occupancy (AirDNA, 2026 Midyear Outlook, Jul 8, 2026).
- San Francisco (+12.1%), Anaheim (+11.0%), and Philadelphia (+10.1%) posted the strongest year-to-date RevPAR growth of any US market through roughly July 2026 (AirDNA, 2026 Midyear Outlook, Jul 8, 2026).
- Actively revenue-managed listings outperformed their local comp set by 24% RevPAR on a 24-month rolling average, across 198 listings in 24 states (RevFactor, "Airbnb & STR Revenue Benchmarks (2026)," updated Sep 21, 2026).
- Under that same active management, the "orphan rate" (unbooked available nights) fell from 25.0% to 11.9% (RevFactor, "Airbnb & STR Revenue Benchmarks (2026)," updated Sep 21, 2026).
- About 69% of the US short-term rental market is now professionally managed (Short Term Rentalz, reporting Rentals United/PriceLabs data, May 14, 2026).
- Active US listings reached 1.76 million in August 2026 (+2.0% YoY), the second straight month of decelerating supply growth (AirDNA, "U.S. Review August 2026," Sep 16, 2026).
- A December 2025 AirDNA forecast expected occupancy to "ease by around 1%" in 2026; by July 2026, the same organization had revised that to finishing the year above the pre-pandemic average (AirDNA, 2026 Outlook Report, Dec 16, 2025, vs. 2026 Midyear Outlook, Jul 8, 2026).
What is the average short-term rental occupancy rate in the US?
US short-term rentals are on pace to average 57.4% occupancy across full-year 2026, according to AirDNA's 2026 Midyear Outlook, published July 8, 2026 (independently corroborated by Short Term Rentalz's direct restatement a day later). The report describes that figure as above the pre-pandemic average of 57.0%. That's the one number worth remembering if you only take one figure from this page, and it's worth remembering what kind of number it is: a trailing, full-year national average, not a reading of any single month or any single market.
Two more recent monthly figures from AirDNA's "U.S. Review" series show how much that annual average can move. Occupancy reached 68.4% in July 2026, up 0.3% year-over-year, typical of the summer peak. It then eased to 57.8% in August 2026, down 3.3% year-over-year, though AirDNA's own report attributes most of that drop to a calendar artifact rather than softer demand: Labor Day fell within August in 2025 and moves into September in 2026, pulling a chunk of bookings out of the year-over-year comparison. Adjust for the holiday shift, AirDNA notes, and August's occupancy looks like a 2.2% gain instead of a loss.
A national average also flattens real market-to-market spread. A listing in a strong coastal market and a listing in a soft secondary market can both be "average" on paper while running very different calendars (more on how far your specific market can sit from the national number in "How far can the national average be from your market?" below).
Why has occupancy held up in 2026 after AirDNA's own December 2025 forecast expected it to soften? The report's own answer is supply, not demand. Available listings grew 2.6% year-over-year in July 2026 and just 2.0% in August, the second straight month of decelerating supply growth. AirDNA's economist ties the slowdown partly to mortgage rates sitting in the high-6% range through mid-to-late 2026, which have discouraged new short-term rental investment. Slower supply growth alongside steady travel demand is the combination behind occupancy holding roughly steady to modestly higher for existing operators, even as fewer new listings compete for the same guests.
What is the average daily rate (ADR) for US short-term rentals?
No single verified annual dollar figure exists for national ADR in 2026, only two verified monthly readings and a couple of percentage-growth forecasts, so this section reports those honestly rather than implying a full-year number that hasn't been confirmed.
AirDNA's "U.S. Review July 2026" report puts ADR at $317.55 for July 2026, up 6.9% year-over-year, which the report calls the fastest ADR growth since August 2024. ADR then cooled to $287.34 in August 2026, up 2.7% year-over-year, per AirDNA's "U.S. Review August 2026" report.
One detail is worth flagging directly, because it's a small, honest example of the disagreement this page addresses in full further down. AirDNA's own August report describes July's ADR growth rate differently than AirDNA's own July report did. The July report's headline figure for July was +6.9%. The August report, framing August's 2.7% growth as a cooling trend, describes July's rate as 5.2%. Both numbers come from AirDNA, both are published, and they don't match. This page reports both, each tied to its own source article, rather than picking whichever one reads better.
On the annual side, only growth-rate forecasts exist, not a dollar figure. AirDNA's December 2025 outlook projected 1.5% ADR growth for 2026; by the July 2026 Midyear Outlook, that had been revised to growth "accelerating from 0.7% in January to about 3% by spring."
One line worth remembering if these reports are new to you: ADR isn't the same thing as an "asking rate." AirDNA calculates ADR as total revenue, including cleaning fees and excluding Airbnb's own service fees, divided by booked nights. It reflects what guests actually paid on nights that actually booked, not what a listing's calendar advertises.
What is RevPAR, and what's the current US benchmark?
RevPAR, which RentalWe's glossary calls RevPAN (revenue per available night), combines occupancy and ADR into a single number. Multiply the two together and you get the average revenue a listing generates per available night, whether or not that night actually booked. It's the metric most worth watching, for reasons covered below.
Nationally, AirDNA puts RevPAR at $217.17 for July 2026, up 7.2% year-over-year, and $166.01 for August 2026, down 0.6% year-over-year (again, mostly the Labor Day calendar effect described above, not a real demand drop). For the full year, AirDNA's Midyear Outlook forecasts RevPAR growth of 2.9% for 2026, a figure the report says is "driven almost entirely by higher ADR" rather than occupancy gains.
You can check this page's own arithmetic against AirDNA's published figures. Multiply July's occupancy (68.4%) by July's ADR ($317.55) and you get roughly $217.20, within a few cents of AirDNA's own reported $217.17 RevPAR for the month. The small gap is just rounding in the published percentages; the two figures are, for practical purposes, internally consistent.
<!-- UNIQUE INSIGHT: This worked-example cross-check multiplies the page's own cited occupancy and ADR figures to reproduce AirDNA's reported RevPAR within rounding. It's original arithmetic performed against the verified source figures, not a new statistic, and it demonstrates the cited numbers are internally consistent, a check most competitor stat pages skip entirely. -->
Why benchmark RevPAR instead of occupancy or ADR alone? Either number in isolation can mislead. A host who drops rates to chase a higher occupancy percentage can end up with lower total revenue per available night even as the calendar fills up. A host who raises rates to chase a higher ADR can end up with more empty nights and lower RevPAR even as the nightly rate looks impressive on paper. RevPAR penalizes both mistakes at once, which is why it's the top-line figure most revenue-management data providers report, not occupancy or ADR individually.
How much does occupancy vary by season?
Only two months of 2026 occupancy are directly verified for this page: 68.4% in July and 57.8% in August. Even that two-month window shows a 10.6-percentage-point swing, more than enough to illustrate how far a single month can move from the 57.4% full-year average cited above.
- Occupancy — July 2026: 68.4%; August 2026: 57.8%; YoY change: +0.3% (Jul), -3.3% (Aug)
- ADR — July 2026: $317.55; August 2026: $287.34; YoY change: +6.9% (Jul), +2.7% (Aug)
- RevPAR — July 2026: $217.17; August 2026: $166.01; YoY change: +7.2% (Jul), -0.6% (Aug)
Source: AirDNA, "U.S. Review July 2026" (Aug 13, 2026) and "U.S. Review August 2026" (Sep 16, 2026). August's year-over-year declines are largely a Labor Day calendar-comparison artifact, not a real demand drop; see below.
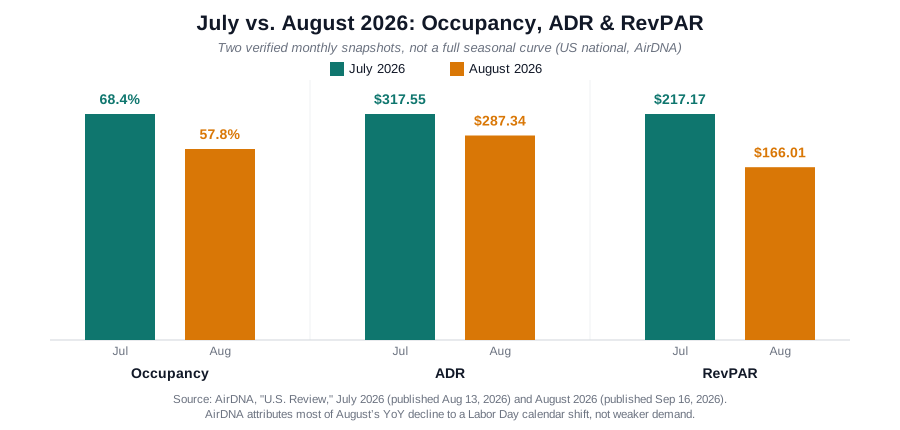
Two verified monthly snapshots, not a full seasonal curve. AirDNA attributes most of August's year-over-year decline to a Labor Day calendar shift rather than weaker demand. Source: AirDNA, "U.S. Review July 2026" (Aug 13, 2026) and "U.S. Review August 2026" (Sep 16, 2026).
That's the honest scope of what's verified here: two data points, not a full seasonal curve. AirDNA's monthly "U.S. Review" archive almost certainly has a complete twelve-month history, but pulling and verifying all twelve months directly was outside what this page's research confirmed, so it shows the two verified months rather than implying a full-year pattern nobody checked. Worth repeating too: most of August's year-over-year drop traces back to the Labor Day calendar shift described above, not a real change in demand.
What this means for budgeting: don't plan a summer week's pricing off the 57.4% annual figure, and don't plan a full year's revenue off a strong July. Two months apart, the same market moved more than 10 percentage points. If you want the full monthly pattern for your specific market rather than a national snapshot, AirDNA and similar providers publish market-level dashboards, covered more in "How far can the national average be from your market?" below.
What active revenue management is worth
A true single-unit-versus-multi-unit revenue benchmark wasn't found in a verifiable primary source for this page. Rather than paper over that gap with a comparison it can't support, here's what actually is verified: a comp-set-relative benchmark for active revenue management, along a different axis than portfolio size.
Actively revenue-managed listings outperformed their local comp set by 24% RevPAR, measured as a 24-month rolling average, according to RevFactor's "Airbnb & STR Revenue Benchmarks (2026)" (published Aug 18, 2026, updated Sep 21, 2026). The sample: 198 listings across 24 states and 67 markets, managed through Blackbird Hospitality.
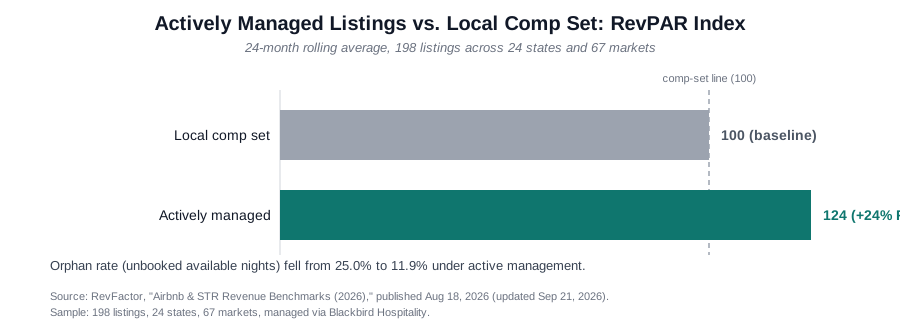
Actively managed vs. comp set, not single-unit vs. multi-unit: this measures management practice, not portfolio size. Source: RevFactor, "Airbnb & STR Revenue Benchmarks (2026)," published Aug 18, 2026, updated Sep 21, 2026. Sample: 198 listings, 24 states, 67 markets, managed via Blackbird Hospitality.
That gap is worth reading carefully, because what's driving it matters more than the number itself. RevFactor's own data points to active management practices, not portfolio size, as the lever. Under management, the sample's orphan rate (the share of available nights that go unbooked) fell from 25.0% to 11.9%. Fewer wasted nights on the calendar, from more attentive pricing and availability management, is a meaningfully different explanation than "bigger operators simply do better." A single-unit host who adopts the same practices, active dynamic pricing, closing calendar gaps, adjusting rates around demand shifts, is working with the same lever this data measures, even though the sample itself is a managed book of business rather than a market-wide baseline.
Worth naming directly: RevFactor is a revenue-management vendor, and this figure comes from its own managed portfolio. That doesn't make the 24% wrong; RevFactor discloses its sample size and methodology, and the figure is verifiable on the page cited above. But it's a vendor's own practice shown to work on its own book of business, not an independent study, and it's worth reading with that in mind.
For market context, not a performance comparison: about 69% of the US short-term rental market is now professionally managed, per Short Term Rentalz's reporting on Rentals United and PriceLabs data (May 14, 2026). That tells you how common active management has become industry-wide. It doesn't, on its own, tell you what a specific host operating one or two units would gain from adopting the same approach. RevFactor's 24% figure is the closest verified proxy this page found, and it comes from one managed portfolio's outperformance against its own comp set, not a controlled study of self-managed hosts before and after switching.
If you operate a handful of units yourself and manage your own pricing, this data doesn't prove you'd gain exactly 24% RevPAR by adopting a management company's practices. What it does show is that closing the gap between a booked calendar and a fully optimized one is where the measurable upside sits, and that gap is something a self-managed host can work on directly, not just something that requires outsourcing to a management company.
Why do occupancy and ADR figures disagree between sources?
<!-- UNIQUE INSIGHT: Synthesizing four genuinely different sources of "disagreement" (measurement window, forecast vintage, what's being compared to what, and same-publisher restatement drift) across multiple providers, rather than reporting a single citable number, is the structural analysis most competing stat pages in this SERP skip entirely. -->
National short-term rental occupancy for 2026 has been reported anywhere from roughly 57% to over 68%, and national ADR growth for the same month, July 2026, has been reported by the same organization as either 6.9% or 5.2%. Neither range is an error. Once you see what each number is actually measuring, the disagreement mostly resolves into "these are different questions," not "someone got it wrong."
Different measurement windows
The clearest example on this page: AirDNA's 57.4% is a full-year 2026 average, its 68.4% is a single named month (July), and its 57.8% is a different single named month (August). All three are correct at the same time because they answer different questions: what's typical across the whole year versus what happened in one specific month. A fourth window shows up elsewhere in the industry. Key Data's July 4th 2026 report measures a four-day holiday window (July 3-6, 2026) against the same four-day window a year earlier, across 25 markets, reporting occupancy pacing up 6.5%, ADR up 5.5%, and RevPAR up 12.4%. That's a percentage change on a specific holiday, not a national annual level, and it isn't directly comparable to AirDNA's national averages above even though both come from credible sources.
Different forecast vintages
AirDNA's own December 2025 outlook expected 2026 occupancy to "ease by around 1%." By AirDNA's July 2026 Midyear Outlook, that forecast had been revised to finishing the year above the pre-pandemic average, 57.4% versus 57.0%. This isn't AirDNA being wrong in December and right in July. It's a forecast doing what forecasts do: updating as real bookings data replaces projections through the year. A number pulled from a December-dated report and a number pulled from a July-dated report, even from the identical source and methodology, can legitimately disagree.
Different things being compared
RevFactor's 24% figure, covered above, measures one managed portfolio's performance against its own local comp set, a relative, portfolio-specific outperformance metric. That's a different kind of number entirely from a national baseline like AirDNA's 57.4%. Comparing them directly, asking whether 24% is "better than" 57%, is a category error, not a real comparison.
Same publisher, restated differently
Even within one organization, a later report's passing reference to an earlier month's growth rate doesn't always match that earlier month's own headline figure, as with AirDNA's 6.9%-versus-5.2% July ADR growth figures above. That's less a methodology difference than a reminder to trace every number back to its own dated source rather than trust a secondhand restatement of it, including this page's own restatements.
None of this resolves to one "real" number, because there isn't one. What it means practically: if you're budgeting for next year, the annual average is your baseline. If you're pricing a specific week, a monthly or market-level figure is closer to what you need. If you're benchmarking your own active-management performance, look for a comp-set-relative metric like RevFactor's, not a national average. And whenever you see a year-over-year percentage, check whether it's measuring a holiday window, a full month, or a full year, and whether it's an actual result or a forecast, before comparing it to any other number on this page or anywhere else.
How far can the national average be from your market?
AirDNA's own year-to-date city data shows how wide that spread can run even among strong-performing markets alone. San Francisco, Anaheim, and Philadelphia posted RevPAR growth of 12.1%, 11.0%, and 10.1% respectively, year-to-date through roughly July 2026, against a national full-year RevPAR growth forecast of just 2.9%. That's three to four times the national pace, in cities that were already outperforming, not underperforming.
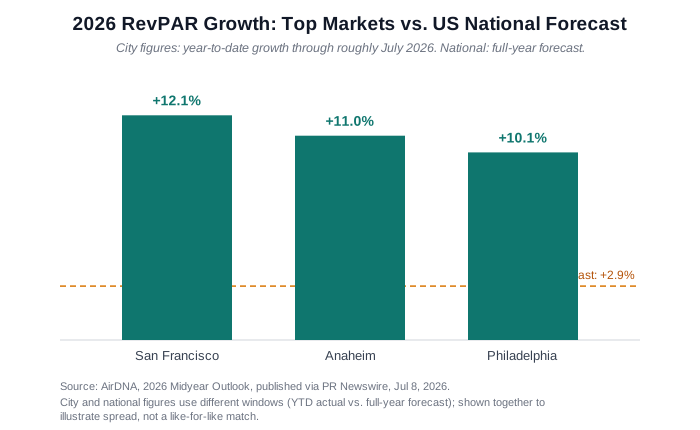
City figures are year-to-date growth through roughly July 2026; the national figure is a full-year forecast, different windows shown together to illustrate spread, not a precise multiplier. Source: AirDNA, 2026 Midyear Outlook, published via PR Newswire, Jul 8, 2026.
Those two figures aren't measured on quite the same clock (one is a partial-year actual, the other a full-year forecast), so treat the comparison as illustrative of spread rather than a precise multiplier. Even accounting for that, the gap is wide enough to make the point: a national number is a starting point for understanding the market broadly, not a benchmark for any specific listing. This page didn't find a verified example of a soft or underperforming market to pair against these leaders, and rather than invent one, it's worth saying plainly: these three cities show how far above the national trend a market can run; a full picture of the market's low end would need its own dedicated, verified research.
If you want to see where your own market or ZIP code sits, rather than guess from a national figure, AirDNA publishes its own outlook and market-level data broken down by location.
Sources, methodology, and update schedule
Every figure on this page was checked directly against its original source page, not taken from a secondary summary or another site's restatement of it, as of September 24, 2026.
Primary sources cited on this page:
- AirDNA, 2026 Midyear Outlook, published via PR Newswire, Jul 8, 2026. prnewswire.com
- AirDNA, "U.S. Review July 2026," by Bram Gallagher, published Aug 13, 2026. airdna.co
- AirDNA, "U.S. Review August 2026," by Bram Gallagher, published Sep 16, 2026. airdna.co
- AirDNA, 2026 Outlook Report, published via PR Newswire, Dec 16, 2025. prnewswire.com
- AirDNA Help Center, occupancy rate methodology. help.airdna.co
- AirDNA Help Center, ADR methodology. help.airdna.co
- RevFactor, "Airbnb & STR Revenue Benchmarks (2026)," published Aug 18, 2026, updated Sep 21, 2026. revfactor.io
- Short Term Rentalz, reporting Rentals United/PriceLabs data on professional management share, May 14, 2026. shorttermrentalz.com
- Key Data, "July 4th 2026 Short-Term Rental Performance Report," published Jun 4, 2026. keydata.co
This page is reviewed quarterly. It was last verified September 24, 2026; the next scheduled review is by December 24, 2026, or sooner if AirDNA publishes a new U.S. Review or outlook update that materially changes a figure above, whichever comes first.
What this page does not claim: it doesn't invent a city-specific occupancy or ADR figure for any market beyond the ones explicitly sourced above. It doesn't state a verified single-unit-versus-multi-unit revenue benchmark; no primary source with that exact breakdown turned up in this page's research (see "What active revenue management is worth" above). It doesn't draw a full twelve-month seasonal curve, because only two months were directly verified. And it isn't legal, tax, or regulatory guidance of any kind. If you need current information on permits, licensing, or local short-term rental rules, check your local regulations directly rather than relying on a pricing statistics page for that.
Frequently asked questions
What counts as a good occupancy rate for a short-term rental?
There's no single verified "good occupancy" threshold that applies to every market. This page didn't find one backed by a traceable primary source, so it doesn't manufacture one just to give you a tidy answer. What's verified instead is context you can use: the national average is 57.4% for full-year 2026, and a strong single month can run well above that (68.4% in July 2026). Whether a given number is "good" for your own listing depends on your specific market, price point, and property type. See "How far can the national average be from your market?" above for how to check your own.
Is short-term rental occupancy going up or down in 2026?
Roughly flat to modestly up, though the honest answer depends on which window you're looking at. AirDNA's full-year 2026 forecast (57.4%) sits above its own pre-pandemic baseline (57.0%). Within the year, July 2026 occupancy was up slightly year-over-year (+0.3%), while August looked down on paper (-3.3%) but was up an estimated 2.2% once you adjust for the Labor Day calendar shift AirDNA describes. Perhaps the clearest signal: AirDNA's own December 2025 forecast expected occupancy to soften in 2026, and by July 2026 the same organization had revised that outlook upward. Nothing here points to a sharp move in either direction. It's a market holding roughly steady with a modest upward lean, credited mostly to slower new supply growth rather than a demand surge.
What's the difference between ADR and RevPAR?
ADR (average daily rate) is the average price paid per booked night; it only counts nights that actually rented. RevPAR (revenue per available rental night) spreads that same revenue across every available night, booked or not, which is why it captures occupancy and pricing at once. See "What is RevPAR, and what's the current US benchmark?" above for the full definition and a worked example.
Do these numbers include mid-term or corporate rentals?
Mostly not, as far as AirDNA's own published methodology describes it. Per AirDNA's FAQ, it collects short-term rental data from Airbnb and Vrbo/HomeAway, plus private hosts and partnerships with property management companies, sources built around nightly and short-stay bookings. That FAQ doesn't call out separate handling for mid-term or corporate housing platforms, so if a meaningful share of your local market's inventory runs through mid-term-focused platforms outside Airbnb and Vrbo, this page's figures likely don't capture it well.
Conclusion
If you only carry three numbers away from this page, make them these: the national occupancy average is 57.4% for full-year 2026, RevPAR is forecast to grow 2.9% this year on the back of rising rates rather than rising occupancy, and actively managing a listing's pricing and availability is worth measurably more than leaving a calendar on autopilot, per RevFactor's 24% comp-set outperformance figure.
None of those numbers mean much without knowing what they're actually measuring, which is the point of "Why do occupancy and ADR figures disagree between sources?" above: the same publisher can report two different growth rates for the same month, and a forecast can shift meaningfully within a single year as real bookings data replaces projections. Trust a number that names its window and its date over one that doesn't.
About the author
Tra Ly writes RentalWe's Pricing & Revenue coverage, focused on the occupancy, rate, and demand data hosts running one to a handful of units need to benchmark their own numbers against.
Common questions
What counts as a good occupancy rate for a short-term rental?
There's no single verified "good occupancy" threshold that applies to every market. This page didn't find one backed by a traceable primary source, so it doesn't manufacture one just to give you a tidy answer. What's verified instead is context you can use: the national average is 57.4% for full-year 2026, and a strong single month can run well above that (68.4% in July 2026). Whether a given number is "good" for your own listing depends on your specific market, price point, and property type. See "How far can the national average be from your market?" above for how to check your own.
Is short-term rental occupancy going up or down in 2026?
Roughly flat to modestly up, though the honest answer depends on which window you're looking at. AirDNA's full-year 2026 forecast (57.4%) sits above its own pre-pandemic baseline (57.0%). Within the year, July 2026 occupancy was up slightly year-over-year (+0.3%), while August looked down on paper (-3.3%) but was up an estimated 2.2% once you adjust for the Labor Day calendar shift AirDNA describes. Perhaps the clearest signal: AirDNA's own December 2025 forecast expected occupancy to soften in 2026, and by July 2026 the same organization had revised that outlook upward. Nothing here points to a sharp move in either direction. It's a market holding roughly steady with a modest upward lean, credited mostly to slower new supply growth rather than a demand surge.
What's the difference between ADR and RevPAR?
ADR (average daily rate) is the average price paid per booked night; it only counts nights that actually rented. RevPAR (revenue per available rental night) spreads that same revenue across every available night, booked or not, which is why it captures occupancy and pricing at once. See "What is RevPAR, and what's the current US benchmark?" above for the full definition and a worked example.
Do these numbers include mid-term or corporate rentals?
Mostly not, as far as AirDNA's own published methodology describes it. Per AirDNA's FAQ, it collects short-term rental data from Airbnb and Vrbo/HomeAway, plus private hosts and partnerships with property management companies, sources built around nightly and short-stay bookings. That FAQ doesn't call out separate handling for mid-term or corporate housing platforms, so if a meaningful share of your local market's inventory runs through mid-term-focused platforms outside Airbnb and Vrbo, this page's figures likely don't capture it well.